
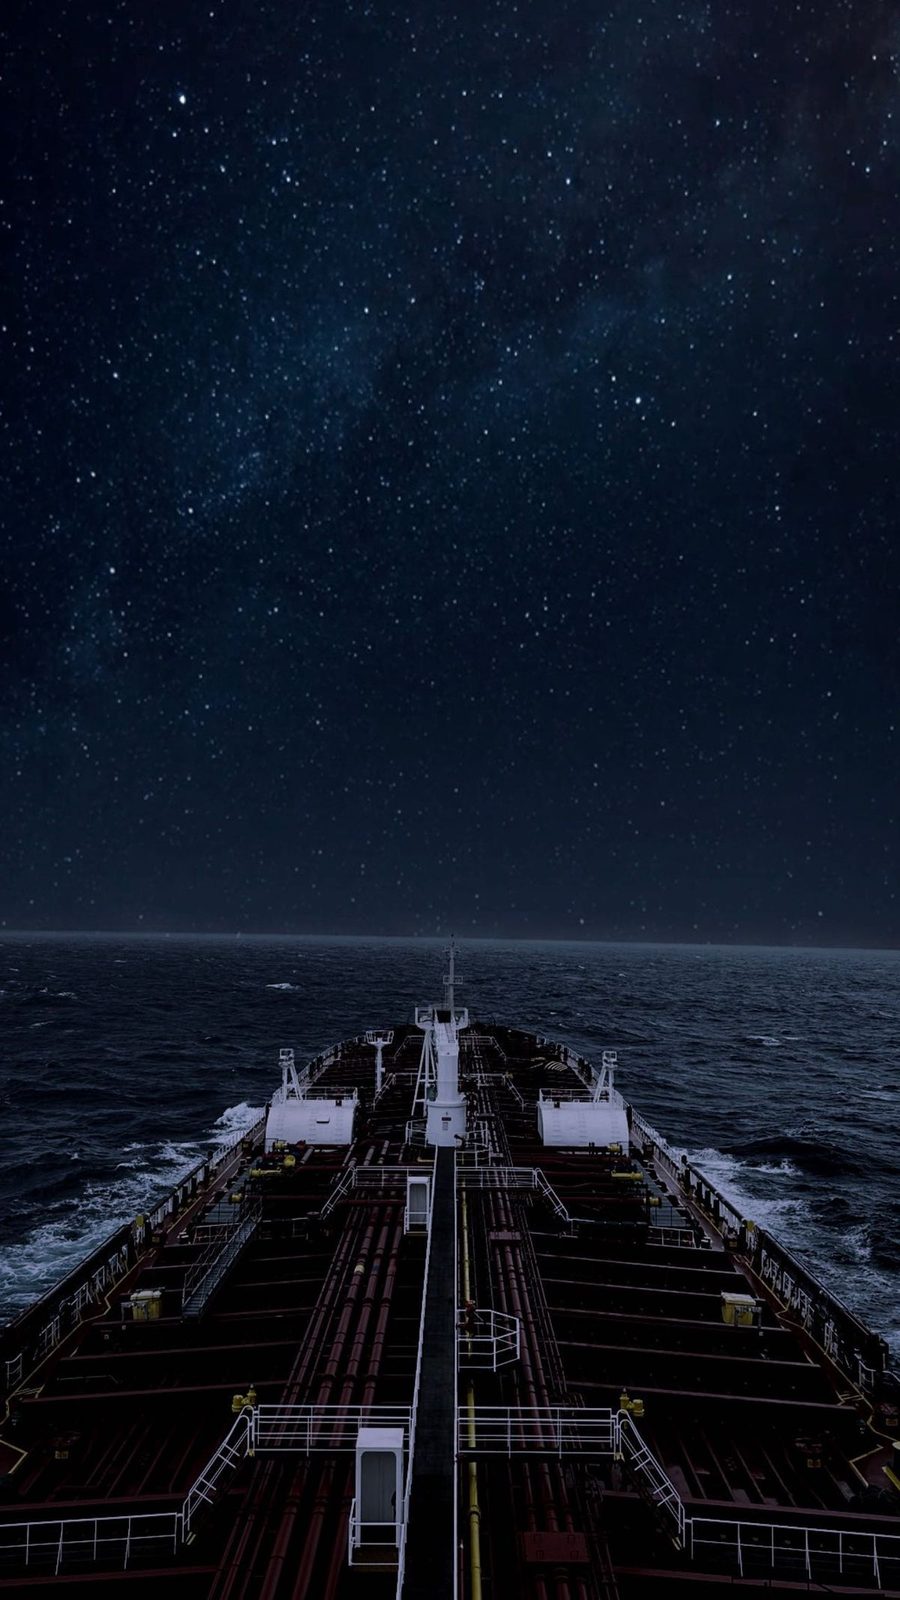
The scale
Maritime transport carries roughly four-fifths of world merchandise trade by volume. It is the cheapest way to move mass over distance that humanity has devised, and its economics shape what is made where.
| Metric | Figure |
|---|---|
| Seaborne trade, 2024 | 12,720 million tonnes |
| Growth, 2024 | +2.2% |
| Ten-year average growth (2013–2023) | +1.8% |
| Projected growth, 2025 | +0.5% |
| Containerised trade growth, projected 2025 | +1.4% |
| Merchant vessels | 85,148 |
| Average fleet age, by tonnage | 12.6 years |
| Average fleet age, by vessel count | 22.2 years |
The 2025 projection is the story. A drop from 2.2% to 0.5% is a significant deceleration, and it arrives at the same time as rising compliance costs — which is precisely the squeeze that drives owners toward outsourced management and operational efficiency.
What moves by sea
| Cargo category | Carried by |
|---|---|
| Iron ore, coal, grain, bauxite, phosphate | Dry bulk carriers |
| Crude oil, refined products | Tankers |
| Chemicals, vegetable oils, specialised liquids | Chemical/parcel tankers |
| LNG, LPG, ammonia | Gas carriers |
| Manufactured goods, retail, components | Container ships |
| Cars, trucks, rolling stock | Ro-ro and car carriers |
| Steel, timber, project cargo, machinery | General cargo and multipurpose |
| Passengers | Cruise ships and ferries |
Why sea transport is so cheap
Three physical facts:
- Water supports the load. No wheels, no track, no roadbed — the ocean carries the weight for free.
- Scale. A large container ship carries the equivalent of tens of thousands of truckloads with one crew of around twenty-five.
- Energy efficiency per tonne-kilometre. Shipping emits far less CO₂ per tonne-kilometre than road or air freight, which is why the sector's absolute emissions matter but its intensity is comparatively good.
The consequence is that transport cost is a small share of the delivered price of most goods, which is what makes globally distributed manufacturing viable.
The main trade lanes
| Lane | Principal cargoes |
|---|---|
| Asia – Europe | Containers, both directions of manufactured goods |
| Transpacific | Containers, Asia to North America |
| Atlantic | Containers, project cargo, chemicals |
| Middle East – Asia | Crude oil, products, LNG |
| Australia/Brazil – Asia | Iron ore |
| US Gulf / Black Sea – global | Grain |
| Intra-Asia | Containers, general cargo |
Chokepoints concentrate risk: Suez, Panama, Malacca, Hormuz, Bab al-Mandab, the Turkish Straits and the Danish Straits. When one closes or becomes dangerous, the effects propagate through the whole network within weeks.
Disruption and its cost
The Red Sea disruption is the clearest recent illustration. Xeneta data for December 2025 showed Far East–Mediterranean transit times at 49 days against 34 days in October 2023, and Far East–North Europe at 52 against 40. Suez container transits ran at around 120 in November 2025 against 583 in October 2023. UNCTAD noted May 2025 transit levels roughly 70% below 2023 averages.
| Consequence | Effect |
|---|---|
| Longer voyages | More fuel, more emissions, more crew time |
| Effective capacity absorbed | Tighter market, higher rates |
| Schedule reliability falls | Container reliability under 30% on affected routes |
| Insurance cost | War risk premiums where transits continue |
| Inventory cost | Shippers hold more stock to cover longer transit |
`[VERIFY]` Re-check current transit volumes and rates before publication; this situation changes.
Emissions and the transition
Shipping emissions rose about 5% in 2024 over 2023, with a reduction observed in the first half of 2025 attributed largely to slower speeds and operational improvements. More than 50% of newbuilding tonnage on order is designed for alternative fuels, while over 90% of the active fleet by tonnage still runs on conventional fuel.
That gap defines the next two decades of maritime transport: a fleet that has committed to change on the order book and has barely begun to change on the water.
trade, fleet and emissions data from UNCTAD Review of Maritime Transport 2025; transit and reliability data from Xeneta, December 2025; fleet count from BIMCO/ICS 2026. Reviewed by the Zeaclub Editorial Team, 24 August 2026.
Frequently asked questions
How much trade goes by sea?
Approximately 80% of world merchandise trade by volume, totalling 12,720 million tonnes in 2024.
Why is sea freight cheaper than air?
Because water supports the vessel's weight, ships achieve enormous scale per crew member, and energy required per tonne-kilometre is very low compared with air or road.
What are the main shipping chokepoints?
The Suez Canal, Panama Canal, Strait of Malacca, Strait of Hormuz, Bab al-Mandab, and the Turkish and Danish Straits.
Is seaborne trade still growing?
Yes, but slowly — 2.2% in 2024 with 2025 projected at just 0.5%, against a ten-year average of 1.8%.